| ¹ Cambridge University Engineering Department | ² Cambridge University Computer Laboratory |
| Trumpington Street, Cambridge, CB2 1PZ, UK | Pembroke Street, Cambridge, CB2 3QG, UK |
| Email: { sej28, glm20, pcw, }@eng.cam.ac.uk | { pj207, ksj }@cl.cam.ac.uk |
This paper presents work done at Cambridge University, on
the TREC-7 Spoken Document Retrieval (SDR) Track. The broadcast news
audio was transcribed using a 2-pass gender-dependent
HTK speech recogniser which ran at 50 times real time and gave
an overall word error rate of 24.8%, the lowest in the track.
The Okapi-based retrieval engine used in TREC-6 by the
City/Cambridge University collaboration was supplemented by
improving the stop-list, adding a bad-spelling mapper and
stemmer exceptions list, adding word-pair information,
integrating part-of-speech weighting on query terms
and including some
pre-search statistical expansion. The final system gave an
average precision of 0.4817 on the reference and 0.4509 on
the automatic transcription, with the R-precision being
0.4603 and 0.4330 respectively.
The paper also presents results on a new set of 60 queries with assessments for the TREC-6 test document data used for development purposes, and analyses the relationship between recognition accuracy, as defined by a pre-processed term error rate, and retrieval performance for both sets of data.
Spoken Document Retrieval (SDR) combines state of the art technology
from the fields of speech recognition and information retrieval.
We combine the high performance HTK speech recogniser with
the tried and tested Okapi-based retrieval engine to produce a
good SDR system, then develop some extensions to improve the system
further. We evaluated performance during development on
the TREC-6 SDR
document data using a set of 60 queries developed in-house (CU60),
and applied our final system in the TREC-7 SDR track.
This paper firstly describes the TREC SDR task and the data used in both development and evaluation of our SDR system. The speech recogniser is described in detail in section 2, where the performance of all the sites participating in the cross-recogniser runs is given. The retrieval engine is then described in section 3 emphasising the innovations introduced for the TREC-7 evaluation and giving results based on both the CU60 development set and the TREC-7 evaluation set. A summary of these results is presented in section 4. The relationship between the output of the speech recogniser and the input of the retriever is discussed in section 5, leading to the introduction of a processed Term Error Rate (TER) to represent the recognition accuracy for SDR systems. Section 6 presents the relationship between this TER and retrieval performance for different speech recognisers and shows the degradation of retrieval performance with increased TER. Finally, conclusions are offered in section 7.
For the TREC-7 SDR track,
audio from American broadcast radio and TV news programs is presented
along with a list of manually-generated document-boundaries.
Natural language text queries, such as ``Have their been any volcanic eruptions in
Montserrat recently?'' are then provided.
The participating sites must generate a transcription of the
audio automatically and run an IR engine on this transcription
to provide a ranked list of potentially relevant documents.
Real relevance assessments generated by humans are then used to evaluate the ranked list in terms of the standard IR measures of precision and recall. Sites may also run their retrieval system on a manually-generated reference transcription, baseline transcription(s) provided by NIST and cross-recogniser transcriptions generated by other participating sites.
There are two main considerations when describing the data for SDR.
Firstly the audio data used for transcription, and secondly the
query/ relevance set used during retrieval.
Table 1 describes the main properties of the former,
whilst Table 2 describes the latter, for the
development and evaluation data sets.
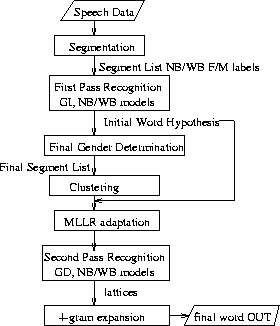
The input data is presented to our HTK transcription system as
complete episodes of broadcast news shows and these are first
converted to a set of segments for further processing. The
segmentation uses Gaussian mixture models to divide the audio into
narrow and wide-band audio and also to discard parts of the audio
stream that contains no speech (typically pure music). The output of a
phone recogniser is used to determine the final
segments which are intended to be acoustically homogeneous.
Further details of the segmenter are given in [5].
Each frame of input speech to be transcribed is represented by a 39
dimensional feature vector that consists of 13 (including
![]() )
cepstral parameters and their first and second differentials.
Cepstral mean normalisation (CMN) is applied over a segment.
)
cepstral parameters and their first and second differentials.
Cepstral mean normalisation (CMN) is applied over a segment.
Our system uses the LIMSI 1993 WSJ pronunciation dictionary augmented
by pronunciations from a TTS system and hand generated corrections.
Cross-word context dependent decision tree state clustered mixture
Gaussian HMMs are used with a 65k word vocabulary. The full HTK
system [12] operates in multiple passes and
incorporates unsupervised maximum likelihood linear regression (MLLR)
based adaptation and uses complex language models via lattice
rescoring and quinphone HMMs. This system gave a word error
rate of 16.2% in the 1997 DARPA Hub4 broadcast news evaluation.
The TREC-7 HTK SDR system uses the first two passes of the 1997 HTK
Broadcast News System [12] in a modified form for
reduced computational requirement. The first pass uses gender
independent, bandwidth dependent cross-word triphone models with a
trigram language model to produce an initial transcription. The output
of the first pass is used along with a top-down covariance-based
segment clustering algorithm [6] to group segments within
each show to perform unsupervised test-set adaptation using maximum
likelihood linear regression based model adaptation
[7, 3].
A second recognition pass through
the data is then performed using a bigram language model to generate
word lattices using adapted gender and bandwidth specific HMMs. These
bigram lattices were expanded using a 4-gram language model and the
best path through these lattices gives the final output. This system
runs in about 50 times real-time on a Sun Ultra2 and achieves an error
rate of 17.4% on the 1997 Hub4 evaluation data. It should be noted
that the error rates on Hub4 data and TREC data are not strictly comparable
in part due to the differences in quality of the reference transcriptions.
The HMMs for TREC-7 used HMMs trained on 70 hours of acoustic data and
the language model was trained on broadcast news transcriptions
ranging in date from 1992 to May 1997 supplied by the LDC and Primary
Source Media (about 152 million words in total). The language model
training texts also included the acoustic training data (about 700k
words). These data were supplemented by 22 million words of texts from
the Los Angeles Times and Washington Post covering the span of the
evaluation period (June 1997 to April 1998 inclusive). Using all these
sources a 65k wordlist was chosen from the combined word frequency list
whilst ensuring that the number of new pronunciations which had to be
created was manageable.
The final wordlist had an OOV rate of 0.3% on the TREC-7 data.
Development work on the TREC-6 test corpus was done using two HTK
based systems. The two pass system (HTK-2) was similar in design to
the final TREC-7 system but used HMMs trained on only the allowable 35
hours of acoustic training data and used a reduced set of texts for language
model training data and only data that was allowable for the TREC-6 tests.
This system gave a word error rate of 24.1% on the TREC-6 test data.
The other system used in TREC-6 development was a single pass system (HTK-1)
and ran in about 45 times real time. This was similar to the first pass of the two
pass system but used more pruning
and gave a word error rate 28.6% on the TREC-6 SDR test data.
We have also used alternative automatic transcriptions to assess the effect of error rate on retrieval performance, namely, for TREC-6 the baseline supplied by NIST (computed by IBM) and the transcription obtained by Sheffield University [1]. For TREC-7 there are the 2 NIST-supplied baselines generated from the CMU recogniser, and cross-recogniser runs from Dragon, ATT, Sheffield and DERA. The full set of comparisons with other SDR sites is given in Table [ NB: development WERs were found on a document (story) basis, but evaluation WERs were on an episode basis.]
| TREC-6 TEST DATA | Corr. | Sub | Del | Ins | Err |
| NIST/IBM Baseline | 59.1 | 33.6 | 7.3 | 9.1 | 50.0 |
| Sheffield | 66.0 | 25.3 | 8.7 | 5.8 | 39.8 |
| HTK-1 | 77.3 | 17.5 | 5.2 | 5.9 | 28.6 |
| HTK-2 | 80.8 | 14.6 | 4.6 | 4.9 | 24.1 |
| TREC-7 TEST DATA | Corr. | Sub | Del | Ins | Err |
| CUHTK | 79.5 | 15.6 | 4.8 | 4.3 | 24.8 |
| Dragon | 74.6 | 18.6 | 6.8 | 4.3 | 29.8 |
| ATT | 73.7 | 20.4 | 5.9 | 4.8 | 31.0 |
| NIST/CMU base1 | 72.1 | 22.6 | 5.3 | 6.7 | 34.6 |
| Sheffield | 69.5 | 23.7 | 6.8 | 5.4 | 35.8 |
| NIST/CMU base2 | 65.8 | 30.1 | 4.1 | 12.9 | 47.1 |
| DERA run 2 | 47.3 | 44.8 | 7.9 | 8.8 | 61.5 |
| DERA run 1 | 39.7 | 47.7 | 12.6 | 5.9 | 66.2 |
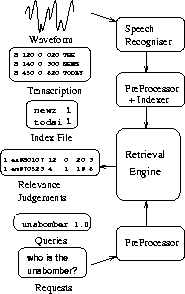
Our benchmark retriever was the Okapi-based system used by the City/ Cambridge University collaboration for quasi-spoken document retrieval in the TREC-6 evaluation [11]. The overall SDR system architecture is illustrated in Figure 2.
The IR system is split into two stages.
Firstly a preprocessor stops and stems the words in all the documents
using a Porter stemmer [8] and
an inverted index file is generated which contains
the number of documents in the collection N, the
length of each document, dl(j),
the number of documents containing each query term, n(i),
and the number of times the term occurs in the given document,tf(i,j).
Following [10] and [9] the main retrieval engine generates a score for each document j for each query by summing the combined weights, cw(i,j) for each query term i produced from the formula:
![]()
where ndl(j) is the length of document j normalised by the
average dl and K and b are tuning constants.
The final ranked list of documents is thus produced for each query by sorting
the returned weights in descending order.
We used our two data sets to explore various refinements to this
benchmark system, for the moment disregarding whether they can be
respectably motivated within the probabilistic model. Thus
for example, as there is some demonstrated retrieval value in simple phrases,
we experimented with this.
Though it is impossible with such a small data set to
assess how useful various retrieval devices are as means of offsetting
speech recognition errors, the fact that with larger collections error
compensation may be more important suggested that it was worth
undertaking some initial work on devices that not only seem to have some
general utility (as shown in past TRECs), but also may have some particular
value in the spoken document context.
The next sections report our comparative experiments using the CU60 queries/assessments for development, and the TREC-7 data for evaluation, with results presented using a subset of the full TREC measures.
The first preprocessing stage is to remove stop words,
so IR performance may thus be affected by
which words are defined as stop words.
Work was done to stabilise our existing standard stoplist.
Initially extra query-specific words, such as find and documents,
were added to the stoplist for queries only. This meant two stop lists
were used, one for the documents and one for the queries.
This was useful, but we went further and developed a new pair of
stoplists specifically for the broadcast news data. Thus
`words' occurring in broadcast news which represent hesitations
in speech, such as uh-huh or hmmm were defined as stop words
and finally some common function words which appeared to have been
overlooked such as am were also added.
The improvement in performance on the development data is given in Table 4. The gain in average precision is 0.7% on the reference and 1.9% on the automatic transcriptions. The greater improvement on the latter is due to the introduction of recogniser-specific hesitations into the stopword list.
|
| AveP | R-P | @5docs | AveP | R-P | @5docs | ||||||
| ref | ref | ref | HTK | HTK | HTK | |||||||
| T6 Stop | 0.6687 | 0.5931 | 0.5600 | 0.6287 | 0.5583 | 0.5267 | ||||||
| New Stop | 0.6758 | 0.5928 | 0.5733 | 0.6478 | 0.5834 | 0.5433 | ||||||
The corresponding performance from introducing these new stoplists on the TREC-7 evaluation is given in Table 5. The average precision on the reference increases by 0.3% whilst for the automatic transcriptions, the increase is 1.7% These results confirm the benefit of using the new stopword lists.
|
| AveP | R-P | @5docs | AveP | R-P | @5docs | ||||||
| ref | ref | ref | HTK | HTK | HTK | |||||||
| T6 Stop | 0.4661 | 0.4481 | 0.5304 | 0.4345 | 0.4242 | 0.5478 | ||||||
| New Stop | 0.4689 | 0.4617 | 0.5565 | 0.4512 | 0.4385 | 0.5826 | ||||||
We tried adding a mapping list for word variants. Some of these mappings only affect
the reference transcriptions, but were included to allow proper
reference/speech comparison. Others might be important for the
automatically transcribed spoken documents.
Reference transcriptions from previous broadcast news evaluations
were used to generate a list of commonly misspelt words. These are
mostly names, such as Chechnia/Chechnya or
Zuganauf/Zuganov/ Zyuganov, but the list also include some words or phrases
in common usage which are often misspelt, such as
all right/alright and baby sit/baby-sit/babysit.
This list was then used to correct the misspelt words by mapping the transcriptions
accordingly.
A few synonyms were also added to the mappings to allow words like
United States/U.S. to be made equivalent.
A stemming exceptions list was also made to compensate for known problems
with the Porter stemmer, such as equating news and new, but not
government and governmental. For ease of implementation
this was also included in the mapping step.
The effect of adding this mapping stage to the preprocessing when using the new stoplists is given in Table 6 for the development data and Table 7 on the evaluation data.
|
| AveP | R-P | @5docs | AveP | R-P | @5docs | ||||||
| ref | ref | ref | HTK | HTK | HTK | |||||||
| New Stop | 0.6758 | 0.5928 | 0.5733 | 0.6478 | 0.5834 | 0.5433 | ||||||
| + Mapping | 0.6960 | 0.6191 | 0.5867 | 0.6746 | 0.6217 | 0.5533 | ||||||
|
| AveP | R-P | @5docs | AveP | R-P | @5docs | ||||||
| ref | ref | ref | HTK | HTK | HTK | |||||||
| New Stop | 0.4689 | 0.4617 | 0.5565 | 0.4512 | 0.4385 | 0.5826 | ||||||
| + Mapping | 0.4769 | 0.4694 | 0.5565 | 0.4422 | 0.4344 | 0.5565 | ||||||
The mapping increased average precision by 2.0% on the reference and
2.7% on the
automatic transcriptions for the development data.
The corresponding effect on the TREC-7 evaluation data was disappointing, with an
increase of 0.8% on the reference, but a decrease of 0.9% on the
automatic transcriptions. When the systems were analysed in more detail, it was found that
the average precision on the HTK transcriptions remained unaltered for 5 queries,
increased for 11 queries, and decreased for 7 queries.
The largest decrease occurred on query 70:
What are the latest developments in gun control in the U.S.? In particular,
what measures are being taken to protect children from guns?
After stopping this became:
latest developments gun control us| particular measures protect children guns
Since the training transcriptions did not always consistently write the
word gunshot as either one or two words, the mapping file contained the map
[gun+shot -> gunshot]. Unfortunately, although this would have helped had the query contained the word
gunshot, it actually degraded performance in this case, as an instance
of the word gun had effectively disappeared from two relevant documents.
Difficulties with words like this exist whether or not mapping is carried out.
For example, suppose the word gunshot had been in the query and no mapping
had been implemented: our system would not have found stories transcribed as
gun shot. Therefore, whether a given mapping is beneficial or not, may depend
on exactly what the query terms are. This is an inherent difficulty with this type
of system and requires either some expansion, or a way of allowing words such
as gunshot to match both gunshot and gun + shot during the scoring
to solve it.
A similar problem arises with query 62:
Find reports of fatal air crashes.
If the mapping [air+force -> airforce] is implemented, then the
score for the relevant document ee970703.22 which contains two instances of
the word-pair [air+force]
decreases from rank 4 to rank 47 due to the two occurrences of the word air,
which can no longer be found.
The conclusion is therefore that mapping in order to correct bad spellings and allow exceptions to the stemming algorithm is a good thing and will improve retrieval performance. However, mappings which convert two words into one when it is not always clear whether the word should exist as one word, a hyphenated word, or two separate words, should be used sparingly, at the system's peril.
Past TREC tests have shown that there is some value in the use of
phrasal terms, though these need not be linguistically, as opposed to
statistically, defined. The most common method is to use a file-based phrasal
vocabulary. However linguistically-motivated phrasal terms drawn from
the request topic have also been used e.g. with INQUERY, and we
decided to try this.
Each query was tagged using a Brill tagger [2]
and pairs of adjacent words with no
interceding punctuation, which followed the sequence N/N or J/N,
where N is a noun or name and J is an adjective,
were marked as word-pairs.
These word-pairs were then weighted and added to the query terms.
The indexing procedure was refined to allow Term Position Indexes (TPIs)
to be stored in an augmented inverted file.
The normal
combined weight measure was applied to the word-pairs, after using the
TPIs to find which documents the word-pairs occurred in.
An example of the word-pairs added in this way is:
| CU60 : | How many people have been murdered by the IRA in |
| Northern Ireland | |
| north_ireland | |
| TREC-7: | What are the latest developments in gun control in the |
| U.S.? In particular, what measures are being taken to | |
| protect children from guns? | |
| gun_control |
The effect of applying this word-pair modelling on the original TREC-6 system
and the system after the new stoplists and mapping
had been applied are given in Tables 8 and 9
for the CU60 and TREC-7 tasks respectively.
The lines labelled `a'(lone) show the impact of this device alone, the lines
labelled `c'(ombined) show the impact of the word-pair device when added to
the previous stopping and mapping.
The addition of word-pair information in development increased the average precision of the combined system by 0.6% on the reference and 0.1% on the automatic transcriptions. The device was therefore included in the evaluation system. Unfortunately it had no effect on average precision for the automatically generated TREC-7 transcriptions and actually worsened performance on the reference. This may be influenced by the number of (stopped) query terms (3.417 per query for CU60, 7.13 for TREC-7) and the number of word-pairs added (1.18 per query for CU60, 1.61 for TREC-7), or may be a result of the different properties of the document sets.
Work in the past within the Okapi framework has not significantly
investigated the use of explicit, as opposed to implicit, linguistic
term characterisation within the probabilistic model (though the model does
not constrain linguistic criteria for the initial choice of base terms).
We nevertheless decided to study the use of linguistic information,
admittedly in an fairly ad-hoc way, but with a view to possibly exploring
it more rigorously later.
It seems that certain
classes of words convey more information than others.
For example, proper names are generally more helpful in finding
specific information than commonly used verbs. To exploit this fact
different weights were given to the query terms depending
on their part-of-speech.
The query terms were tagged using the Brill tagger and then subsequently divided into one of four groups: Proper Noun (PN), Common Noun (CN), Adjective or Adverb (AA) and the rest, mainly consisting of verbs and hence denoted VB. The weights which gave the greatest increase in average precision on the development data and were therefore incorporated into the retrieval system proved to be:
| Proper Noun (names) | 1.2 |
| Common Noun | 1.1 |
| Adjective & Adverbs | 1.0 |
| Verbs and the rest | 0.9 |
confirming the belief that names generally hold more specific indications than
common nouns, which in turn are better then adjectives, adverbs and verbs.
The effect of applying this POS weighting on the original TREC-6 system and the system after the new stoplists, mapping and word-pairs had been applied are given in Tables 10 and 11 for the CU60 and TREC-7 tasks respectively. [A small bug in the integration of POS weighting and mapping resulted in the gain in the submitted evaluation run being slightly lower than that quoted here.]
Also included in Table 11 are
the results for the case of [PN=1.3 CN=1.2 AA=1.0 VB=0.8] labelled as
opt as they provided an optimal set for the improvement in average precision
for the HTK transcriptions on the TREC-7 evaluation data.
The results without including word-pairs on the TREC-7 data are given as
a comparison and labelled as c-wp.
Implementing the chosen POS weights gave an increase in average precision of
0.94% on the reference and 0.42% on the HTK transcriptions for
the CU60 development set and 0.94% on the reference and 0.76% on the HTK
transcriptions for the TREC-7 evaluation set.
Increasing the relative weights of nouns further for the TREC-7 task
can be seen to increase average precision on the HTK-recogniser
run, whilst leaving the reference unaffected. An additional increase
can be gained by removing the word-pair device.
Care should be taken when increasing the difference between the query POS weights since this naturally interacts with the stemming because the information about part-of-speech in the documents is generally lost during the stemming procedure.
Following widespread TREC practice we decided to try pre-search
expansion using statistical term
co-occurrences, [10, 13]
both as a device
for including terms related to the query terms and to compensate for
inadequate stemming. In principle this should be based on actual text
data, for example, by using a parallel text corpus, but we used the
transcribed document set. Note this is not ideal due to the document
set being small and the presence of transcription errors.
Our expansion system, e(xpansion), adds a new stem E based on an original
stem O when the probability of the original term being present
in a document given that the expanded term is present,
P(O|E), is greater than a half.
This is equivalent to saying the expanded stem is more likely to occur
when the original stem is present than when it is absent.
Only stems which occur
in more documents than the original were added and terms
which occur in over 2% of the documents were not expanded
to reduce over-expansion problems.
An additional development , r(oots), was also included to enhance the stemming
process. This involved adding stems which have a common root of
at least five letters with the original stem.
The basic weight assigned to an expanded term is P(O|E), namely the probability of the original term occurring given the expanded term. The weights for the original source and expanded terms are both normalised to give a total equal to the original term weight. Thus for a term weight, T, the weights for the original and expanded terms are:
![]()
The results are given in Tables 12 and 13 for the CU60 and TREC-7 data respectively.
These results [These results are better than those submitted due
to a bug in the expansion code.], show that the basic expansion, exp1,
increases average precision on both the benchmark and combined system for CU60
queries.
The addition of roots to the expansion process increases average precision
on the benchmark CU60 system, but does not for the combined system.
This is probably because the additional terms are added as a consequence of bad
performance by the stemmer, for example Californian ->California,
teaching -> teacher. Hence,
when the expansion was added to the system which already included the stemming
exceptions list, the performance no longer increased.
The system used in the evaluation, therefore used the basic expansion
system, exp1, but not the roots expansion as it was thought the
stemmer-exceptions list offered better compensation for the problems with
stemming.
The expansion device increased average precision on the combined TREC-7
system by 0.6% on the reference and 0.7% on the automatic transcriptions.
The roots expansion decreased average precision on the automatic transcription
as predicted, but actually increased average precision on the reference system.
This may be partially due to the fact that the stemmer-exceptions list was
manually generated from just the TREC-6 test data.
It is important to note that only a few words in a few queries have been expanded. The effect of this kind of query expansion could therefore be very different with a larger set of queries and documents. In addition, term co-occurrences may be better estimated using a larger distinct but similar collection of documents (e.g previous broadcast news stories).
Finally the model parameters b and K were tuned to give maximum average precision on the HTK transcriptions for the combined system on the CU60 data set. The results for this are given in Table 14 for the CU60 data set and 15 for the TREC-7 data set.
To summarise the foregoing results we show two Tables 16
and 17, showing respectively
the separate contributions of the various devices detailed above, and
their combined effects.
The overall improvement in average precision on the HTK transcriptions
from adding all these new features is 5.5%.
The equivalent results for TREC-7 are given in section 4.2.
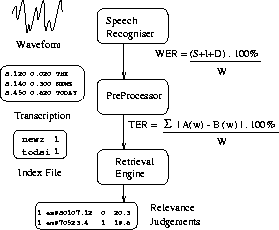
Speech recognition accuracy is conventionally expressed in terms of word error rate (WER). To calculate this an alignment of the hypothesised and reference transcriptions is made and the number of insertion (I) , deletion (D) and substitution (S) errors are found. For W words in the reference transcription, the word error is then given by:
![]()
When the transcriptions are subsequently used for information retrieval, WER does not accurately reflect the input to the retrieval stage (see figure 3). Firstly, stop words are removed, some words are mapped, and the words are stemmed; secondly, the order of the words is not considered in the standard retrieval case, so an alignment is not necessary, and finally a traditional substitution error can be thought of as two errors, as it not only misses a correct word, but also introduces a spurious one. When investigating recognition accuracy for SDR, we therefore use a Term Error Rate
![]()
where A(w) and B(w) represent the number of times word w occurs in the reference A and the transcription B. TER therefore models the output of the pre-processor rather than the speech recogniser and is more appropriate when considering subsequent retrieval performance.
The pre-processing stages of stopping, stemming and mapping have a great influence on the property of the data input to the information retriever. For example, the number of words for each stage for the TREC-6 and TREC-7 test data using our TREC-7 preprocessor is given in Table 21.
| TREC-7 DATA | |||||
| Recogniser | original | +abbrev | +map | +stop | +stem |
| Reference | 765274 | 757848 | 756262 | 354258 | 354250 |
| CUHTK | 764707 | 757141 | 755774 | 347364 | 347322 |
| Dragon | 749253 | 742857 | 741633 | 348581 | 348578 |
| ATT | 759899 | 753153 | 751890 | 340680 | 340680 |
| Base1 | 787199 | 780518 | 779252 | 349221 | 349159 |
| Sheff | 757870 | 750966 | 749889 | 361135 | 361053 |
| Base2 | 845284 | 838188 | 836757 | 344622 | 344535 |
| DERA2 | 776151 | 770109 | 769259 | 359326 | 359296 |
| DERA1 | 717027 | 712844 | 712238 | 371499 | 371443 |
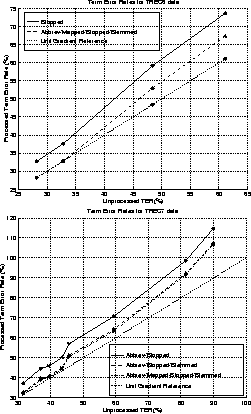
The corresponding WER at each of these processing stages is given in
Table 22 and the relationship between these WERs is shown in
Figure 4.
| TREC-6 DATA | ||||
| Recogniser | original | +stop | +map | +abbrev+stem |
| IBM Baseline | 50.0 | 47.5 | 47.2 | 44.3 |
| Sheffield | 39.8 | 37.6 | 37.1 | 34.6 |
| HTK-1 | 28.6 | 24.9 | 24.7 | 22.2 |
| HTK-2 | 24.1 | 21.5 | 21.2 | 18.7 |
| TREC-7 DATA | |||||
| Recogniser | original | +abbrev | +map | +stop | +stem |
| CUHTK | 24.8 | 25.0 | 24.9 | 22.8 | 22.3 |
| Dragon | 29.8 | 29.9 | 29.8 | 27.6 | 26.8 |
| ATT | 31.0 | 31.2 | 31.1 | 28.2 | 27.4 |
| Base1 | 34.6 | 34.3 | 34.2 | 30.8 | 30.0 |
| Sheffield | 35.8 | 36.0 | 35.9 | 34.4 | 33.4 |
| Base2 | 47.1 | 47.2 | 47.1 | 43.4 | 42.0 |
| DERA2 | 61.5 | 61.7 | 61.6 | 60.0 | 59.0 |
| DERA1 | 66.2 | 66.4 | 66.3 | 69.1 | 67.7 |
The results on the TREC-6 data suggest that the WER after stopping and stemming can be predicted reasonably accurately from the original WER. However, this is not as clear from the TREC-7 results. The DERA1 run is the only one where the WER goes up after stopping, meaning that the stopped words are recognised better on average than the non-stop words. This is not usually the case for ASR systems, since the smaller stop-words which carry less information content are generally more confusable than content words.
Term error rates are more appropriate when considering speech recognition
for SDR problems because they model the input to the retriever
more accurately.
Note, not producing any output gives a TER of 100%
whereas misrecognising every word as on OOV word produces a TER of
200%, due to each substitution error counting as both an insertion and
deletion error. Misrecognising every word will in practise give a TER
of below 200% as the word ordering is unimportant, so some recognition errors
will cancel out.
The corresponding TER at each of the pre-processing stages is given in Table 23 and the relationship between these TERs is shown in Figure 5. It is interesting to note that on both data sets at low TER, complete preprocessing does not seem to affect the TER. As the recognition performance of the system decreases, so the effect on TER of preprocessing increases.
| TREC-6 DATA | |||
| Recogniser | original | +stop | +map+abbrev+stem |
| IBM Baseline | 61.1 | 73.7 | 67.4 |
| Sheffield | 48.4 | 59.2 | 53.0 |
| HTK-1 | 32.9 | 37.6 | 32.8 |
| HTK-2 | 28.2 | 32.8 | 28.2 |
| TREC-7 DATA | ||||
| Recogniser | original | +abbrev+stop | +stem | +map |
| CUHTK | 31.6 | 37.2 | 32.7 | 32.1 |
| Dragon | 36.9 | 44.6 | 39.6 | 39.0 |
| ATT | 39.5 | 45.9 | 40.8 | 40.2 |
| Base1 | 43.5 | 50.2 | 45.0 | 44.3 |
| Sheffield | 45.6 | 57.0 | 51.2 | 50.4 |
| Base2 | 59.4 | 70.7 | 64.2 | 63.4 |
| DERA2 | 81.5 | 98.7 | 92.3 | 91.7 |
| DERA1 | 89.9 | 114.7 | 107.3 | 106.7 |
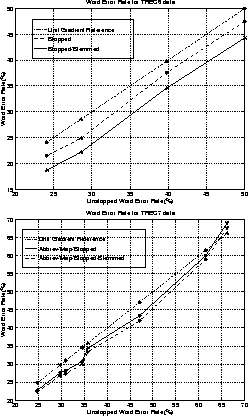
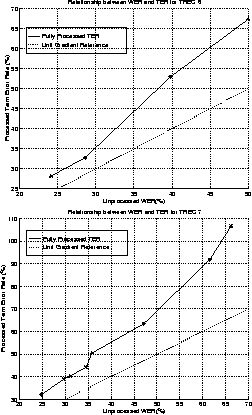
It is interesting to compare the relationship between our new metric,
the stopped/ stemmed/ mapped TER and the standard measure of speech
recognition performance, namely the unprocessed word error rate.
A graph showing the relationship between these is shown in
Figure 6.
The difference between unprocessed WER and processed TER increases as WER increases. This implies that in fact the input to the retriever degrades more rapidly than would be predicted from the WER.
It is also interesting to realise that stopping the documents increases term error rate, although it decreases (aligned) word error rate. This is thought to be because the majority of cancelling errors occur with the shorter, stopped words, so the cancelling effect is reduced by stopping, hence increasing TER. Stemming will always reduce both WER and TER.
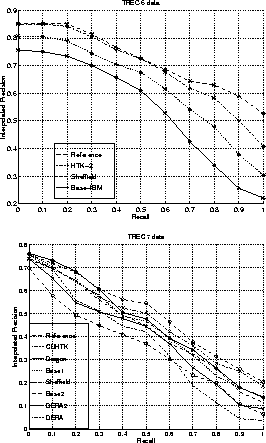
The average precision, R precision and precision at 5, 10 and 30 documents recall is given for the different SDR runs in Table 24. This relationship between the average precision and the stop/stem/map TER is plotted in Figure 7 with R-precision in Figure 8. The interpolated recall-precision averages, plotted in Figure 9 show the IR performance of the different systems.
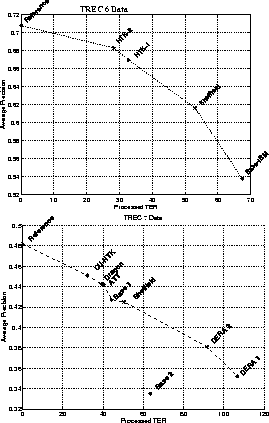
Figure 7: Relationship between TER and Average Precision
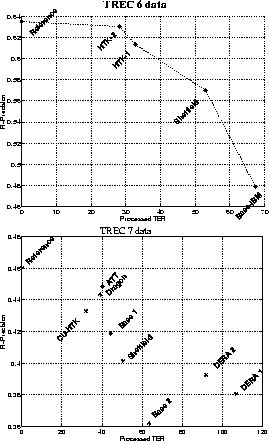
Figure 8: Relationship between TER and R Precision
| TREC-7 DATA | |||||
|
| PTER | AveP | R-Prec. | @5docs | @10docs |
| Reference | 0.0 | 0.4817 | 0.4603 | 0.6000 | 0.4739 |
| CUHTK | 32.1 | 0.4509 | 0.4330 | 0.5565 | 0.4522 |
| Dragon | 39.0 | 0.4428 | 0.4434 | 0.5652 | 0.4435 |
| ATT | 40.2 | 0.4419 | 0.4485 | 0.5652 | 0.4485 |
| Base1 | 44.3 | 0.4272 | 0.4187 | 0.5478 | 0.4261 |
| Sheff | 50.4 | 0.4251 | 0.4015 | 0.5478 | 0.4391 |
| Base2 | 63.4 | 0.3352 | 0.3619 | 0.4348 | 0.3826 |
| DERA2 | 91.7 | 0.3810 | 0.3925 | 0.5217 | 0.4043 |
| DERA1 | 106.7 | 0.3521 | 0.3806 | 0.5478 | 0.3957 |
These results show that in general average precision decreases with TER. The insertion rate may be an important influence on this as the TREC-7 base 2 recogniser, which has an insertion rate of 13.0% as opposed to the others which have between 4.3 and 8.8%, seems to produce worse IR performance than predicted. The relationship between R-precision and TER is not as clear cut and the precision-recall graphs show the degradation of IR performance on TREC-7 is not just related to TER.
It is not possible to draw any strong conclusions from our TREC-7
experiments. This is partly because, in contrast to TREC as a whole, there
is no trend data: TREC-6 used the different, known-item retrieval task.
But more importantly, the test data is too small for reliable and
informative inference. It seems to be the case that the basic Okapi-style
system works satisfactorily on both reference and
automatically-transcribed data,
illustrating its power for documents of a rather different
discourse type from those used hitherto, and for ones in a different
medium. But while retrieval performance using our recogniser transcriptions
is near that for the
reference data, it is not clear what impact recognition failures would have
on retrieval with a much larger data set or
very different forms of query. For the same reason, while
we can hypothesise that particular retrieval devices may be not just
useful in general but particularly appropriate for speech data, we
cannot come to any firmly predictive conclusions on their individual
or combined value.
We have investigated the effects of changing stop-lists, adding bad-spelling correctors, a stemming exceptions list and basic synonym mapping, including word-pair information, weighting query terms by their part-of-speech and adding pre-search statistical expansion. Whilst all of these have been shown to increase IR performance under certain circumstances, the increases are small. Nevertheless the combination of these devices led to an increase in average precision on the TREC-7 evaluation data of 2.74% on the reference and 2.27% on the automatic transcriptions over last year's system.
Our thanks go to Steve Renals at Sheffield for providing their transcriptions for the TREC-6 test data and to Cedric Auzanne at NIST for confirmation of WER results for the TREC-7 evaluation. This work is in part funded by an EPSRC grant reference GR/L49611.